
This UITF from the second largest bank in PH has outperformed its benchmark, and its holdings still have upside…also, ACEN tearsheet

This unit investment trust fund (UITF) from the first private Philippine universal bank has outperformed its benchmark, the Philippine Stock Exchange Composite Index (PSEi). Moreover, the average Uniform ROA for its holdings is 6%, 1.5x the as-reported average.
Although as-reported metrics would leave investors confused with the fund’s stock picks, Uniform Accounting helps make sense of the fund’s investments and how it continues to outperform the market.
In addition to examining the fund’s portfolio, we are including fundamental analysis of one of the fund’s largest holdings, providing you with the current Uniform Accounting Performance and Valuation Tearsheet for that company.
Philippine Markets Daily:
Friday Uniform Portfolio Analytics
Powered by Valens Research
UCPB, established in 1963, was the first private Philippine bank to become a universal bank, obtaining its expanded commercial banking license in 1981. Since then, it has grown to become one of the Philippines’ leading universal banks, delivering a full range of expanded commercial banking services to a diversified clientele.
With a tagline of “It’s personal”, UCPB’s brand promise is to be “personal” in building enduring relationships with customers and “proactive” in providing value in their services.
Under UCPB’s financial markets segment are its investment and trust products, which include consumer finance, commercial credit, corporate and investment banking, trust banking, domestic and international trade finance, treasury and money market investment, cash management, and deposit services.
We’ve written about UCPB’s funds before: UCPB High Dividend Fund and UCPB Philippine Index Equity Fund. This week, we’ll revisit one of their other funds, the UCPB Equity Fund.
With the goal of providing long-term investment growth, UCPB launched the UCPB Equity Fund (UEF) on January 15, 2007. UEF is an equity trust fund that invests in companies listed in the Philippine Stock Exchange, with the Philippine Stock Exchange Index as its benchmark.
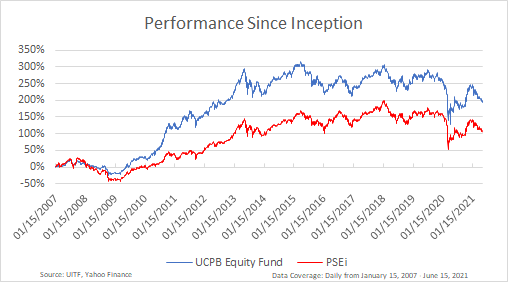
At its inception in January 2007, UCPB Equity Fund’s initial net asset value per unit (NAVPU) was PHP 1.00.
The fund’s NAVPU soared to a peak of PHP 4.15 in April 2015, its 315% gain for the period outperforming its benchmark’s gain of 169%. It then dropped 23% to PHP 3.18 from its peak due to the oil price crash, slightly outperforming the PSEi’s loss of 25%.
Since then, the fund’s NAVPU rose to a 2018 high of PHP 4.08, a gain of 28% from its 2016 low. The PSEi’s 49% gain over the same period outperformed the fund. However, the NAVPU dropped to as low as PHP 2.27 in April 2020 due to the pandemic, with its 44% loss underperforming the PSEi’s 38% loss in the same period.
As of June 15, 2021, the fund posted a NAVPU of PHP 3.25. Its 43% gain from its previous low has outperformed the benchmark’s 25% gain. More importantly, the UCPB Equity Fund has had a cumulative 225% gain since inception that far outperforms its benchmark’s cumulative 131% gain.
As-reported metrics would have investors believe that the fund’s portfolio consists of companies that do not generate economic profit. However, Uniform Accounting reveals the truth behind the companies this fund invests in.
The table below shows the top eight core non-financial holdings of the UCPB Equity Fund along with its Uniform return on assets (ROA), as-reported ROA, and ROA distortion—the difference between Uniform and as-reported ROA.
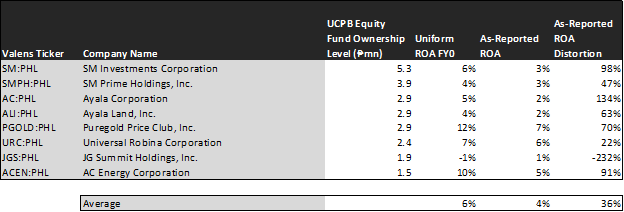
Most of the companies in the UCPB Equity Fund show as-reported ROAs at or below cost-of-capital levels, suggesting that they are not generating economic profit. The fund is generating an average as-reported ROA of 4%, lower than the global corporate average returns of 6%.
However, on a Uniform Accounting basis, this UITF’s holdings have actually delivered stronger returns with an average Uniform ROA of 6%, 1.5x the average as-reported ROA. These companies have strong returns, with some companies having Uniform ROAs above global average returns.
The Uniform Accounting framework addresses financial statement inconsistencies attributable to the flaws present in the Philippine Financial Reporting Standards (PFRS). This enables investors to determine the true underlying performance of companies and avoid distorted financial analysis and valuation.
As such, it should not be surprising that when analyzing the non-financial holdings of the UCPB Equity Fund, the figures that easily stand out are the large discrepancies between Uniform ROA and as-reported ROA for these companies.
While at a glance, the difference between as-reported ROA and Uniform ROA may not seem that great, the distortion in percentage ranges from -232% to 134%, with Ayala Corporation (AC:PHL), SM Investments Corporation (SM:PHL), and AC Energy Corporation (ACEN:PHL) having the highest positive distortions.
As-reported metrics understate the profitability of Ayala Corporation, suggesting an unprofitable firm with an as-reported ROA of 2%. In reality, this firm more closely resembles one that is breaking even, with its Uniform ROA of 5%. Prior to the pandemic, it consistently generated returns of at least 9% through 2005-2019.
Similarly, as-reported metrics understate the profitability of SM Investments Corporation, suggesting a below-average firm with an as-reported ROA of 3% when in fact, it has a Uniform ROA in line with the average cost of capital of 6%. It has consistently generated returns of at least 6% since 2005.
Likewise, as-reported metrics understate the profitability of AC Energy Corporation, suggesting an average firm with an as-reported ROA of 5%. In reality, this is an above-average firm with a 10% Uniform ROA, or double its as-reported ROA.
By focusing on as-reported metrics alone, these companies look like anything but profitable businesses.
That said, looking at profitability alone is insufficient to deliver superior investment returns. Investors should also identify if the market is significantly undervaluing a company’s earnings growth potential.
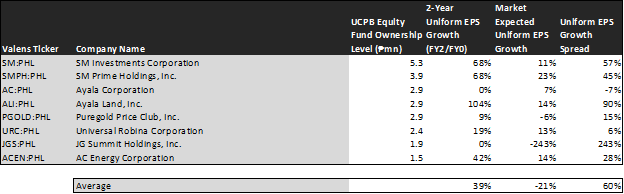
This table shows the earnings growth expectations for the major non-financial holdings of the fund. It features three key data points:
- The two-year Uniform earnings per share (EPS) growth represents the Uniform earnings growth the company is likely to have for the next two years. The earnings number used is the value of when we convert consensus sell-side analyst estimates according to the Uniform Accounting framework.
- The market expected Uniform EPS growth represents what the market thinks Uniform earnings growth is going to be for the next two years. Here, we show by how much the company needs to grow Uniform earnings in the next two years to justify the current stock price of the company. This is the market’s embedded expectations for Uniform earnings growth.
- The Uniform EPS growth spread is the difference between the 2-year Uniform EPS growth and market expected Uniform EPS growth.
On average, Philippine companies are expected to have 5%-6% annual Uniform earnings growth over the next two years. Meanwhile, UCPB Equity Fund’s major holdings are forecast to outperform with a 39% projected Uniform earnings growth in the next two years, while the market is forecasting a drastic underperformance with a 21% projected Uniform earnings shrinkage.
All the companies in the UCPB Equity Fund have a positive Uniform earnings growth spread except for Ayala Corporation. Among these companies, JG Summit Holdings, Inc. (JGS:PHL) and Ayala Land, Inc. (ALI:PHL) have the highest positive Uniform earnings growth spread.
The market is pricing JGS’s Uniform Earnings to shrink by 243% in the next two years, while sell-side analysts are projecting the company’s earnings to be immaterial.
Likewise, the market is pricing ALI’s Uniform Earnings to grow by 14% in the next two years, while sell-side analysts are projecting the company’s earnings to grow by 104%.
Overall, as-reported numbers would have investors incorrectly conclude that this portfolio consists of low-quality companies. While these firms suffer from the adverse effects of the coronavirus pandemic, dragging down their short-term earnings growth expectations, Uniform Accounting metrics show that these companies have intact business models that should drive economic profitability moving forward.
SUMMARY and AC Energy Corporation Tearsheet
Today, we’re highlighting one of the individual stock holdings in the UCPB Equity Fund—AC Energy Corporation (ACEN:PHL).
As the Uniform Accounting tearsheet for AC Energy Corporation highlights, it trades at a Uniform P/E of 43.4x, above both the global corporate average of 23.7x, and its historical average of 20.9x.
High P/Es require high EPS growth to sustain them. In the case of AC Energy Corporation, the company has shown a 161% Uniform EPS shrinkage in 2020.
Sell-side analysts provide stock and valuation recommendations that poorly track reality. However, sell-side analysts have a strong grasp on near-term financial forecasts like revenue and earnings.
We take sell-side forecasts for Philippine Financial Reporting Standards (PFRS) earnings as a starting point for our Uniform earnings forecasts. When we do this, AC Energy Corporation’s sell-side analyst-driven forecast shows that Uniform earnings are expected to decline by 49% in 2021 and grow by 299% in 2022.
Based on the current stock market valuations, we can back into the required earnings growth rate that would justify ACEN’s PHP 7.87 stock price. These are often referred to as market embedded expectations.
AC Energy Corporation is currently being valued as if Uniform earnings were to grow by 14% per year over the next three years. What sell-side analysts expect for ACEN’s earnings growth is below what the current stock market valuation requires in 2021 but above that requirement in 2022.
The company has an earning power above long-run corporate averages, and its cash flows and cash on hand consistently exceed obligations within five years. This indicates a low dividend risk.
To conclude, AC Energy Corporation’s Uniform earnings growth is well below peer averages, but is trading well above peer average valuations.
About the Philippine Market Daily
“Friday Uniform Portfolio Analytics”
Investors who don’t engage in the buying or selling of securities for a living oftentimes rely on professionals to manage their own investments within the scope of their investment policies.
With so many funds and managers out there, it can get confusing and difficult to decide which one best suits your needs as an investor.
Every Friday, we focus on one fund in the Philippines and take a deeper look into their current holdings. Using Uniform Accounting, we identify the high-quality stocks in their portfolio which may not be obvious using the as-reported numbers.
We also identify which holdings may be problematic for the fund’s returns that they would need to reconsider from a UAFRS perspective.
To wrap up the fund analysis, we highlight one of their largest holdings and focus on key metrics to watch out for, accessible in our tearsheets.
Hope you’ve found this week’s focus on the UCPB Equity Fund interesting and insightful.
Stay tuned for next week’s Friday Uniform Portfolio Analytics!
Regards,
Angelica Lim
Research Director
Philippine Markets Daily
Powered by Valens Research
www.valens-research.com


