
Uniform Accounting affirms that this growth-oriented mutual fund can live up to its name with its above-average TRUE earnings growth

This investment management company rolled out a new mutual fund five months ago to provide an alternative investment opportunity for investors.
Placing their best stock picks in one basket, the firm seeks to deliver investment returns better than the local equity investment barometer, the Philippine Stock Exchange Index (PSEi).
As-reported metrics would leave investors confused with the fund’s stock picks. However, Uniform Accounting shows the reality of companies they invest in and how they fit into the firm’s investment strategy.
In addition to examining the fund’s portfolio, we’re including fundamental analysis of one of the fund’s largest holdings, providing you with the current Uniform Accounting Performance and Valuation Tearsheet for that company.
Philippine Markets Daily:
Friday Uniform Portfolio Analytics
Powered by Valens Research
Alpha and beta are performance measures used to evaluate stocks, funds, and other investment securities relative to a benchmark or a market index.
Beta is a measure of volatility. It shows how a fund moves with a benchmark over time. A beta greater than one indicates that the fund’s price swings higher than the market, while a beta less than one means that the fund’s price fluctuates lower than the market.
Meanwhile, alpha is a measure of outperformance or underperformance. It shows how the investment returns of a fund compare to its benchmark over time. A positive alpha means the fund generated investment returns higher than the market, while a negative alpha indicates that the fund produced returns lower than the market.
Most investors have always preferred a high positive alpha. In fact, generating positive alpha is what most professional managers around the globe are aiming for.
This is exactly the goal Philequity Management, Inc. (PEMI) had in mind when it launched its seventh mutual fund, the Philequity Alpha One Fund (PAOF), on December 9, 2019.
Philequity is known for its high performing mutual fund, the Philequity Fund, which we highlighted in February 2020.
Employing the same investing philosophy they had in Philequity Fund and coupling it with all their learnings over the past years, Philequity hopes to deliver maximum returns through the active management of PAOF.
PAOF comprises Philequity’s best stock picks—companies with strong growth potential, solid business models, or significant catalysts.
Investment managers understand how hard it is to find these types of companies, especially in the depressed market environment we are in, which is driven by the global COVID-19 pandemic.
In fact, PAOF saw a lackluster -16% investment performance over the first four months of the year. Its benchmark, the PSEi, did worse with -26% performance over the same time frame.
That said, companies with strong growth potential and solid business models tend to endure tough times such as today, delivering high-quality performance over the long term.
Philequity knows this very well as they closely followed similar market depressions in the past—the Asian financial crisis in 1997, the dot-com bubble in 2001, and the Great Recession in 2007-2009.Wilson Sy, director of PEMI and the fund manager of Philequity Fund, even wrote a book titled, Opportunity of a Lifetime: Investment Secrets Behind the Success of Philequity Fund, which chronicled his learnings from past historical financial events.
Analyzing PAOF using as-reported figures, it is not obvious that they picked companies with strong growth potential and solid business models.
As-reported numbers would have investors incorrectly believe that these companies are low-quality, with gloomy growth potential. This could lead to skewed insights, negatively affecting the entire investment decision making process.
However, Uniform Accounting paints a very different picture. With Uniform Accounting metrics, investors can see the true underlying performance and earnings growth potential of companies.
The table below lists the top non-financial holdings of PAOF along with their Uniform return on assets (ROA), as-reported ROA, and ROA distortion—the difference between Uniform and as-reported ROA.
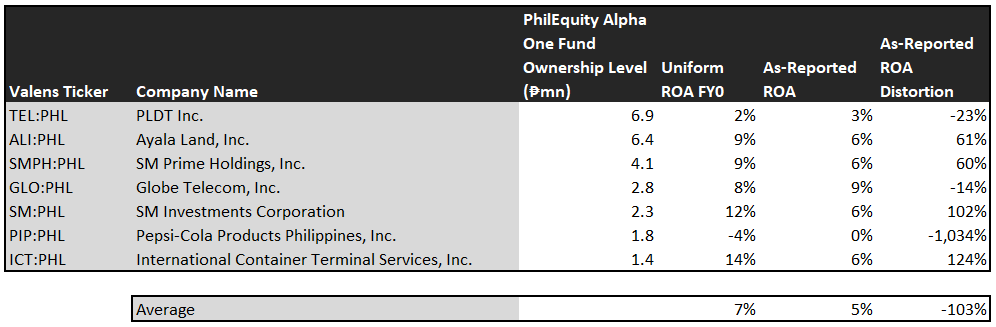
Most of Philequity Alpha One Fund’s holdings show as-reported returns that range around and below global cost-of-capital level, suggesting that they are not generating economic profit. However, Uniform Accounting reveals that in reality, the majority of these companies have above-average profitability.
In turn, traditional metrics would have investors believe that this fund is subpar with an average as-reported ROA of 5%, below global corporate average returns of 6%. But the reality is, under the Uniform Accounting framework, the companies’ in the fund’s portfolio display a stronger average Uniform ROA of 7%.
Uniform Accounting adjusts for the misrepresentations in companies’ financial statements brought about by the inconsistencies in the Philippine Financial Reporting Standards (PFRS) to reveal the true underlying performance of companies.
As such, it should not be surprising that when analyzing the non-financial holdings of the Philequity Alpha One Fund, the figures that easily stand out are the double-digit discrepancies between Uniform ROA and as-reported ROA for these companies.
While at a glance, the difference between as-reported ROA and Uniform ROA may not seem that great, the distortion in percentage, excluding the -1,034% outlier, ranges from -23% to 124%, with International Container Terminal Services, Inc. (ICT:PHL) and SM Investments Corporation (SM:PHL), both having distortions above a hundred percent.
As-reported ROA understates the earning power of ICT, suggesting that this leading port management company is an average firm with a 6% as-reported ROA. In reality, this company is a high-quality firm with a 14% Uniform ROA, more than twice the global corporate average returns.
Similarly, as-reported numbers incorrectly treat SM Investments Corporation as an average company with an as-reported ROA of 6%. In reality, it is an above-average firm with a 12% Uniform ROA.
By focusing on as-reported metrics alone, Philequity would never pick most of these companies because they look like anything but high-quality companies with profitable business models.
However, to find companies that can deliver alpha, just looking at companies where as-reported metrics misrepresent a company’s real profitability is insufficient.
To generate alpha, any investor must also identify if the market is significantly undervaluing the company’s potential.
PAOF is also invested in companies with unreasonably low market expectations.
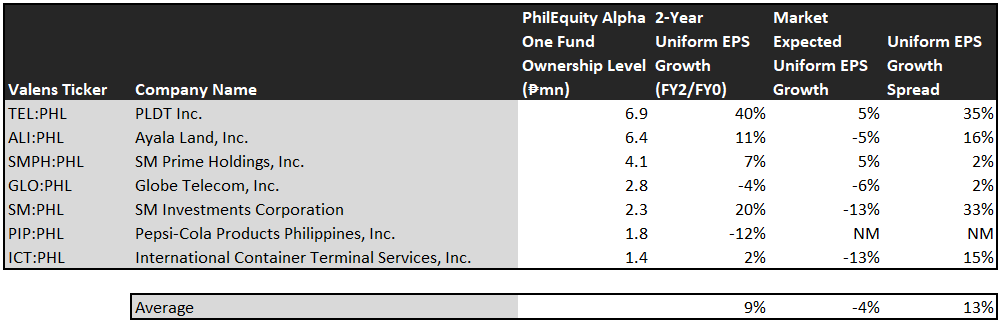
This table shows the earnings growth expectations for the major company ownerships of Philequity Alpha One Fund. It features three key data points:
- The 2-year Uniform EPS growth represents the Uniform earnings growth the company is likely to have for the next two years. The earnings number used is the value of when we convert consensus sell-side analyst estimates to the Uniform Accounting framework.
- The market expected Uniform EPS growth represents what the market thinks Uniform earnings growth is going to be for the next two years. Here, we show by how much the company needs to grow Uniform earnings in the next two years to justify the current stock price of the company. This is the market’s embedded expectations for Uniform earnings growth.
- The Uniform EPS growth spread is the difference between the 2-year Uniform EPS growth and market expected Uniform EPS growth.
On average, Philippine companies are expected to have 6% annual Uniform earnings growth over the next two years. However, the market sees a decline in earnings for these companies with market-expected Uniform EPS shrinkage of 4% over the next two years.
In reality, PAOF’s top holdings are forecast to deliver strong 9% Uniform earnings growth in the next two years.
Among these companies, PLDT Inc. (TEL:PHL) and SM Investments Corporation have the highest Uniform earnings growth dislocation.
The market is mispricing PLDT’s Uniform earnings, expecting it to grow by 5% in the next two years. However, sell-side analysts are forecasting it to accelerate by 40% going forward.
Additionally, the market is seeing SM Investments Corporation’s Uniform earnings to shrink by 13%, but analysts are projecting an impressive 20% earnings growth for the firm in the next two years.
That being said, there are a few companies we’d recommend Philequity to take another look at.
Pepsi-Cola Products Philippines, Inc. (PIP:PHL) is forecast to see its Uniform earnings plummet by 12% a year going forward. PIP has not been generating economic profit as well since 2015 under Uniform Accounting.
Meanwhile, both the market and sell-side analysts are expecting the Uniform earnings of Globe Telecom, Inc. (GLO:PHL) to decline around 4%-6% going forward.
They do not seem to be companies with superb earning growth potential that Philequity would want to invest in. If anything, earnings projections for these companies appear bearish.
On a positive note, most of PAOF’s holdings look like an undervalued set of high-quality stocks with businesses displaying solid earning power and strong earnings growth potential. It just isn’t clear on an as-reported basis, incorrectly leading investors to think that this mutual fund is subpar with depressed earnings expectations.
Unsurprisingly, Uniform Accounting reveals the reality behind these companies’ underlying fundamentals, affirming that PAOF can live up to its name in the long run.
Globe Telecom, Inc. Tearsheet
Today, we’re highlighting one of the largest individual stock holdings in Philequity Alpha One Fund—Globe Telecom, Inc.
As our Uniform Accounting tearsheet for Globe Telecom highlights, it trades at a Uniform P/E of 16.3x, below global corporate averages but around historical averages.
Low P/Es require low EPS growth to sustain them. In the case of Globe Telecom, the company has recently shown a robust Uniform EPS growth of 20%.
Sell-side analysts provide stock and valuation recommendations that poorly track reality. However, sell-side analysts have a strong grasp on near-term financial forecasts like revenue and earnings.
We take sell-side forecasts for PFRS earnings as a starting point for our Uniform earnings forecasts. When we do this, Globe Telecom’s sell-side analyst-driven forecast shows that Uniform earnings will grow by 1% in 2020 and decline by 9% in 2020.
Based on the current stock market valuations, we can back into the required earnings growth rate that would justify PHP 2,196.00 per share. These are often referred to as market embedded expectations.
In order to meet the current market valuation levels of Globe Telecom, the company would have to see Uniform earnings shrink by 6% each year over the next three years. Sell-side analysts’ expected 9% earnings shrinkage for the company falls short of what the current stock market valuation requires.
The company has an earning power slightly above long-run corporate averages—based on its Uniform ROA calculation. However, with cash flows and cash on hand falling short of obligations beginning 2022, Globe Telecom has a moderate dividend risk.
To conclude, Globe Telecom’s Uniform earnings growth is well below peer averages. Moreover, the company is trading around peer average valuations.
About the Philippine Markets Daily
“Friday Uniform Portfolio Analytics”
Investors who don’t engage in the buying or selling of securities for a living oftentimes rely on professionals to manage their own investments within the scope of their investment policies.
With so many funds and managers out there, it can get confusing and difficult to decide which one best suits your needs as an investor.
Every Friday, we focus on one fund in the Philippines and take a deeper look into their current holdings. Using Uniform Accounting, we identify the high-quality stocks in their portfolio which may not be obvious using the as-reported numbers.
We also identify which holdings may be problematic for the fund’s returns that they would need to reconsider from a UAFRS perspective.
To wrap up the fund analysis, we highlight one of their largest holdings and focus on key metrics to watch out for, accessible in our tearsheets.
Hope you’ve found this week’s focus on Philequity Alpha One Fund interesting and insightful.
Stay tuned for next week’s Friday Uniform Portfolio Analytics!
Regards,
Angelica Lim
Research Director
Philippine Markets Daily
Powered by Valens Research
www.valens-research.com


