
Uniform Accounting shows this company’s spin-off of its non-core business improved ROA, though not to new highs as as-reported metrics suggest

Operating in different industries has its advantages. However, having diversified products and services could end up doing more harm than good, prompting companies to spin off their non-core companies.
This firm spun off most of its companies and kept only its timeshare business. As a result, this company was able to focus on expanding and transforming its operations through brand improvements and acquisitions.
Looking at as-reported metrics, it seems that spinning off its other businesses proved to be significant in boosting the company’s profitability to record highs. However, TRUE UAFRS-based (Uniform) analysis shows that the rise in profitability has yet to surpass historical highs.
Also below, Uniform Accounting Embedded Expectations Analysis and the Uniform Accounting Performance and Valuation Tearsheet for the company.
Philippine Markets Daily:
Thursday Uniform Earnings Tearsheets – Global Focus
Powered by Valens Research
Conglomerates are diversified businesses that have multiple divisions operating in different industries. It’s a great strategy to expand income streams and reduce the risk of a full income loss caused by a problematic segment, similar to how diversification would work for an investment portfolio.
The reason above is mainly why one might think a diversified business should increase shareholder value.
In reality, investors tend to value highly diversified businesses less than the sum of its parts. The reason why this conglomerate discount is applied is that, in general, the burden of operating a conglomerate offsets its benefits.
For one, it’s much more difficult to run effectively considering differing operations, industry trends, and management values. Also, conglomerate financial statements are more complicated, making it more difficult to attribute performance to a specific segment and potentially creating transparency issues.
Overall, investors see focused firms as better at creating shareholder value than diversified firms do—and companies are seeing it too, with some of them spinning off non-complementary businesses.
Take Kraft (KHC) for example. It spun off Cadbury because it realized that it was running two businesses with entirely different growth rates and strategic requirements. This strategy led to unlocking significant value in the process, with Uniform ROAs consistently rising to new highs.
Wyndham Worldwide has gone through a similar situation.
In 2006, the company was spun off from Cendant Corporation, a provider of travel and residential real estate services. The spin-off was a part of Cendant’s plan to separate into four different companies to enable the management teams to better focus on each segment, assigning Wyndham Worldwide to handle the hotel and real estate division.
While the company’s hotel and timeshare business looked complementary at first, like Kraft and Cadbury, its operations, capital structure, and growth requirements were anything but.
Hotel companies, such as Marriott (MAR), are more asset-light and typically use franchise agreements. Timeshare businesses, on the other hand, are real estate developers. They enable customers to share proprietorship, while also giving the buyer the right to use those properties for a given amount of time.
In 2018, Wyndham Worldwide spun off its hotel business, Wyndham Hotel and Resorts (WH). It kept its timeshare business and changed its name to Wyndham Destinations (WYND).
Both companies seem to have benefited from the spin-off. Specifically, for Wyndham Destinations, which was able to focus on building more destination properties and experiences for customer network expansion and brand transformation.
Wyndham Destinations’ global presence has reached around 110 countries, which means that over four million of its members will have more vacation options to choose from.
Furthermore, due to increasing competition, the company continued to expand its business by making global acquisitions in its core timeshare business, as well as in other businesses such as vacation home swaps (Love Home Swap) and private booking (Alliance Reservations Network).
With a renewed focus that enabled Wyndham Destinations to strategically expand its brand portfolio and its consumer base, one might expect profitability to be pushed higher.
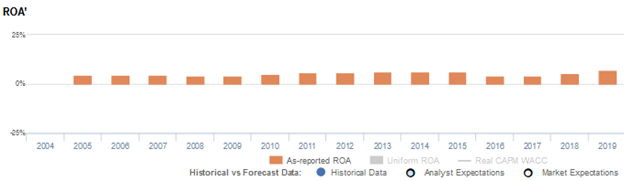
Looking at as-reported metrics, it seems spinning off its hotel business to focus on its timeshare business did in fact boost its profitability to new levels, with as-reported ROA increasing from 4% pre-spin-off to a peak of 7% post-spin-off.
However, Uniform metrics would argue differently. Although the spin-off did unlock value for Wyndham Destinations, with Uniform ROA moving from 8% in 2017 to 11% in 2019, it has only gone up to previous levels. Uniform ROA does not show profitability hitting new highs as as-reported metrics suggest.
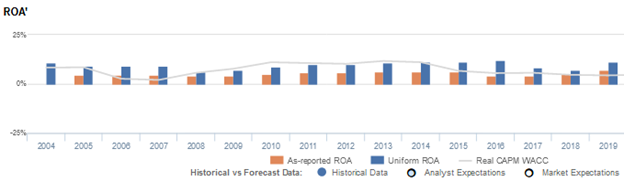
The distortion between Uniform and as-reported ROAs comes from as-reported metrics failing to consider the amount of goodwill on Wyndham Destination’s balance sheet. The company’s goodwill has ranged from $900 million to $1.6 billion, at least 12% of its total assets in recent years, due to its extensive focus on acquisitions.
Goodwill is an intangible asset that is purely accounting-based and unrepresentative of the company’s actual operating performance. When as-reported accounting includes this in a company’s balance sheet, it creates an artificially inflated asset base.
As a result, as-reported ROAs are not capturing the full picture of Wyndham Destinations’ hotel business spin-off. Adjusting for goodwill, we can see that the company hasn’t actually unlocked massive value from being a focused enterprise.
Wyndham Destinations’ earning power is actually more robust than you think

As-reported metrics distort the market’s perception of the firm’s recent profitability. If you were to just look at as-reported ROA, you would think that the company is a much weaker business than real economic metrics highlight.
Wyndham Destinations’ Uniform ROA has actually been higher than its as-reported ROA in the past sixteen years. For example, as-reported ROA was 7% in 2019, but its Uniform ROA was actually significantly higher at 11%. When Uniform ROA peaked at 12% in 2016, as-reported ROA was only at 4%.
Through Uniform Accounting, we can see the company’s true ROAs have actually been much higher. Wyndham Destinations’ Uniform ROA for the past sixteen years has ranged from 6% to 12%, while as-reported ROA ranged only from 4% to 7% over the same timeframe.
Wyndham Destinations’ Uniform earnings margins are generally weaker than you think, but its Uniform asset turns slightly make up for it

Wyndham Destinations’ profitability has been driven by stability in Uniform earnings margins and trends in Uniform asset turns.
From 2004 to 2008, Uniform earnings margins declined from 14% to a low of 8%, before recovering to and stabilizing at 13%-14% levels in 2010-2015. Thereafter, Uniform margins climbed to a peak of 18% in 2016, before fading to 13% in 2019.
Meanwhile, Uniform asset turns ranged from 0.7x-0.8x levels in 2004-2008, before fading to 0.6x levels in 2009-2010 and expanding to 0.9x in 2015. Then, Uniform turns compressed back to 0.6x in 2016, before recovering to 0.9x levels in 2018-2019.
At current valuations, markets are pricing in expectations for both Uniform earnings margin and Uniform asset turns to reach new peaks.
SUMMARY and Wyndham Destinations’ Tearsheet
As the Uniform Accounting tearsheet for the Wyndham Destinations, Inc. (WYND) highlights, its Uniform P/E trades at 37.9x, which is above corporate average valuation levels and its own recent history.
High P/Es require high EPS growth to sustain them. In the case of Wyndham Destinations, the company has recently shown a 159% Uniform EPS growth.
Wall Street analysts provide stock and valuation recommendations that provide very poor guidance or insight in general. However, Wall Street analysts’ near-term earnings forecasts tend to have relevant information.
We take Wall Street forecasts for GAAP earnings and convert them to Uniform earnings forecasts. When we do this, Wyndham Destination’s Wall Street analyst-driven forecast is a 173% and a 189% EPS decline in 2020 and 2021, respectively.
Based on current stock market valuations, we can use earnings growth valuation metrics to back into the required growth rate to justify Wyndham Destinations’ $47 stock price. These are often referred to as market embedded expectations.
The company needs Uniform earnings to grow 7% each year over the next three years to justify current prices. What Wall Street analysts expect for Wyndham Destination’s earnings growth is well below what the current stock market valuation requires in 2020 and 2021.
Furthermore, the company’s earning power is 2x the corporate average. However, cash flows and cash on hand are below its total obligations—including debt maturities, capex maintenance, and dividends. Together, this signals a high credit and dividend risk.
To conclude, Wyndham Destinations’ Uniform earnings growth is around peer averages, but the company is trading well above average peer valuations.
About the Philippine Market Daily
“Thursday Uniform Earnings Tearsheets – Global Focus”
Some of the world’s greatest investors learned from the Father of Value Investing or have learned to follow his investment philosophy very closely. That pioneer of value investing is Professor Benjamin Graham. His followers:
Warren Buffett and Charles Munger of Berkshire Hathaway; Shelby C. Davis of Davis Funds; Marty Whitman of Third Avenue Value Fund; Jean-Marie Eveillard of First Eagle; Mitch Julis of Canyon Capital; just to name a few.
Each of these great investors studied security analysis and valuation, applying this methodology to manage their multi-billion dollar portfolios. They did this without relying on as-reported numbers.
Uniform Adjusted Financial Reporting Standards (UAFRS or Uniform Accounting) is an answer to the many inconsistencies present in GAAP and IFRS, as well as in PFRS.
Under UAFRS, each company’s financial statements are rebuilt under a consistent set of rules, resulting in an apples-to-apples comparison. Resulting UAFRS-based earnings, assets, debts, cash flows from operations, investing, and financing, and other key elements become the basis for more reliable financial statement analysis.
Every Thursday, we focus on one multinational company that’s particularly interesting from a UAFRS vs as-reported standpoint. We highlight one adjustment that illustrates why the as-reported numbers are unreliable.
This way, we gain a better understanding of the factors driving a particular stock’s returns, and whether or not the firm’s true profitability is reflected in its current valuations.
Hope you’ve found this week’s Uniform earnings tearsheet on a multinational company interesting and insightful.
Stay tuned for next week’s multinational company highlight!
Regards,
Angelica Lim
Research Director
Philippine Markets Daily
Powered by Valens Research
www.valens-research.com


