
An unorthodox strategy to keep up with its rival worked well for this company, with Uniform Accounting showing returns sustained at 20%+ levels

Some businesses use a market penetration strategy to diversify their brand portfolio. Others use that same strategy to increase demand for their existing products.
This company, despite never having surpassed their rival company, was able to enter into new markets and increase its product share while strengthening its own brand at the same time.
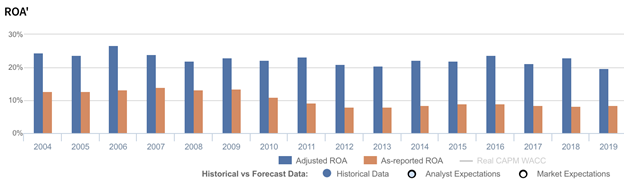
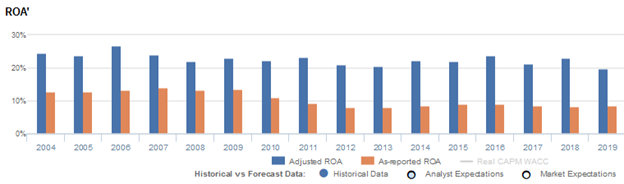
While as-reported data make it appear that returns have only gotten worse due to the execution of this strategy, Uniform Accounting shows that it has actually helped the company maintain stable returns over 20%.
Also below, Uniform Accounting Embedded Expectations Analysis and the Uniform Accounting Performance and Valuation Tearsheet for the company.
Philippine Markets Daily:
Thursday Uniform Earnings Tearsheets – Global Focus
Powered by Valens Research
Entering into new markets to spur demand for existing products is not a strategy that is new to the world of business.
Disney (DIS) entered the video-on-demand space, previously dominated by streaming giant Netflix, with the launch of its own platform Disney+. Its goal was to monetize the vast content it already has, which they have done successfully, unlocking massive growth potential for the company.
Last week, we also talked about another company, Expedia (EXPE), whose returns fell dramatically after Google (GOOGL) decided to compete with the company directly by entering the travel market with Google Travel.
Google placed Google Travel at the top of travel-related search results, and was able to siphon online traffic from travel websites like Expedia and Booking and increase demand for its own offerings.
Much like these companies, Pepsi (PEP) had executed a similar strategy.
There are only so many brands of soft drinks to choose from, but at the top of the list are rival beverage companies Coke (KO) and Pepsi.
However, Coke has always overshadowed Pepsi. We’ve talked about how Coke successfully uses marketing and advertising strategies to create a powerful brand and stay at the top of the game.
Consumer brand loyalty for Coke posed a major problem for Pepsi. But instead of taking Coke head on, Pepsi decided to take a different route—that is, by expanding into various fast food chains.
Through the acquisitions of Pizza Hut in 1977, Taco Bell in 1978, and later, KFC in 1986, Pepsi was able to amass a sizable portfolio of popular fast food franchises. For these restaurants, the only soft drinks available were Pepsi beverages.
By becoming the sole supplier to these food chains, Pepsi was able to keep Coke out of the frame and strengthen its own soft drink brand by taking market share.
Although entering the fast food market was a huge stepping stone for Pepsi, eventually, its food division began to drag on operations. Restaurants had different operational requirements than traditional beverage companies.
For one, capital expenditures were much higher. To lessen the asset load, Pepsi thought of transitioning their food segment into a franchise model—allowing franchisees to own a restaurant for a fee—but even then, the segment only had below cost of capital returns.
Keeping both businesses together didn’t make sense anymore and Pepsi quickly realized this. In 1997, the company spun-off their food operations to what would be known now as Yum! Brands (YUM).
However, even after the spin-off, Pepsi managed to maintain good relationships with these fast food chains. The company used this “goodwill” as leverage to continue being the soft drink supplier of choice as it was in the past, benefiting its core beverage business greatly.
However, as-reported metrics indicates that Pepsi’s expansion strategy through acquisitions has only led to a decline in returns from 13%-14% in 2004-2009 to 8%-9% in recent years.
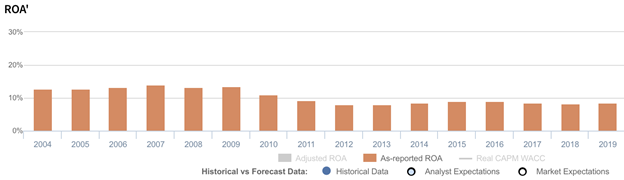
In reality, Uniform Accounting shows that the Pepsi’s strategic acquisitions have actually helped the company sustain ROAs over 20%.
The distortion comes from as-reported metrics failing to consider the amount of accumulated goodwill on Pepsi’s balance sheet, which sits at about $14 billion to $15 billion in recent years, stemming from their aforementioned acquisitions and other acquisitions such as Frito-Lay, Quaker Oats and Tropicana.
Goodwill is an intangible asset that is purely accounting-based and unrepresentative of the company’s actual operating performance. When as-reported accounting includes this in a company’s balance sheet, it creates an artificially inflated asset base.
As a result, as-reported ROAs are not capturing the strength of Pepsi’s earning power. Adjusting for goodwill, which historically has been nearly half its assets, returns are actually 2x-3x greater.
Although Pepsi was unable to surpass Coke as the top soft drink in the market, through its market expansion strategy, the company was able to strengthen its brand identity and benefit from being a solid #2 as a result.
Pepsi’s earning power is actually more robust than you think
As-reported metrics distort the market’s perception of the firm’s recent profitability. If you were to just look at as-reported ROA, you would think that the company is a much weaker business than real economic metrics highlight.
Pepsi’s Uniform ROA has actually been higher than its as-reported ROA in the past sixteen years. For example, as-reported ROA was 9% in 2019, but its Uniform ROA was actually more than 2x higher at 20%.
Through Uniform Accounting, we can see that the company’s true ROAs have actually been much higher. Pepsi’s Uniform ROA has ranged from 20% to 27% in the past sixteen years while as-reported ROA ranged only from 8% to 22% in the same timeframe.
After rising to a peak of 27% in 2006, Uniform ROA declined to 21% in 2013 before expanding to 24% in 2016. It then compressed to 20% in 2019.
Pepsi’s Uniform earnings margins are weaker than you think, but its robust Uniform asset turns make up for it

Pepsi’s profitability has been driven by trends in Uniform earnings margins and Uniform asset turns.
From 2004-2012, Uniform earnings margins gradually declined from a peak of 14% to 11%, before expanding to 12% in 2016. It then compressed to a low of 11% in 2019.
Meanwhile, Uniform turns increased from 1.8x in 2004 to a peak of 1.9x in 2006, before compressing to 1.7x in 2009. It then expanded back to 1.9x in 2016, before declining back to 1.8x in 2019.
At current valuations, markets are pricing in an expectation for continued Uniform margins and Uniform turns expansion.
SUMMARY and PepsiCo Tearsheet
As the Uniform Accounting tearsheet for PepsiCo, Inc. (PEP) highlights, its Uniform P/E trades at 33.3x, which is above corporate average valuation levels and its own recent history.
High P/Es require average EPS growth to sustain them. In the case of PepsiCo, the company has recently shown a 7% Uniform EPS contraction.
Wall Street analysts provide stock and valuation recommendations that in general provide very poor guidance or insight. However, Wall Street analysts’ near-term earnings forecasts tend to have relevant information.
We take Wall Street forecasts for GAAP earnings and convert them to Uniform earnings forecasts. When we do this, PepsiCo’s Wall Street analyst-driven forecast is a 12% EPS shrinkage in 2020 and a 13% EPS growth in 2021.
Based on current stock market valuations, we can use earnings growth valuation metrics to back into the required growth rate to justify PepsiCo’s $187 stock price. These are often referred to as market embedded expectations.
The company needs Uniform earnings to grow 7% each year over the next three years to justify current prices. What Wall Street analysts expect for PepsiCo’s earnings growth is below what the current stock market valuation requires in 2020, but is above its requirement in 2021.
Furthermore, the company’s earning power is 3x the corporate average. However, cash flows are below its total obligations—including debt maturities, capex maintenance, and dividends. Together, this signals a moderate risk to its dividend.
To conclude, PepsiCo’s Uniform earnings growth is in line with its peer averages in 2020, but the company is trading above average peer valuations.
About the Philippine Market Daily
“Thursday Uniform Earnings Tearsheets – Global Focus”
Some of the world’s greatest investors learned from the Father of Value Investing or have learned to follow his investment philosophy very closely. That pioneer of value investing is Professor Benjamin Graham. His followers:
Warren Buffett and Charles Munger of Berkshire Hathaway; Shelby C. Davis of Davis Funds; Marty Whitman of Third Avenue Value Fund; Jean-Marie Eveillard of First Eagle; Mitch Julis of Canyon Capital; just to name a few.
Each of these great investors studied security analysis and valuation, applying this methodology to manage their multi-billion dollar portfolios. They did this without relying on as-reported numbers.
Uniform Adjusted Financial Reporting Standards (UAFRS or Uniform Accounting) is an answer to the many inconsistencies present in GAAP and IFRS, as well as in PFRS.
Under UAFRS, each company’s financial statements are rebuilt under a consistent set of rules, resulting in an apples-to-apples comparison. Resulting UAFRS-based earnings, assets, debts, cash flows from operations, investing, and financing, and other key elements become the basis for more reliable financial statement analysis.
Every Thursday, we focus on one multinational company that’s particularly interesting from a UAFRS vs as-reported standpoint. We highlight one adjustment that illustrates why the as-reported numbers are unreliable.
This way, we gain a better understanding of the factors driving a particular stock’s returns, and whether or not the firm’s true profitability is reflected in its current valuations.
Hope you’ve found this week’s Uniform earnings tearsheet on a multinational company interesting and insightful.
Stay tuned for next week’s multinational company highlight!
Regards,
Angelica Lim
Research Director
Philippine Markets Daily
Powered by Valens Research
www.valens-research.com


