
This massive conglomerate has digitally got it all for you, achieving a Uniform ROA of 6%, not 3%

Despite being largely recession-proof, these businesses weren’t spared from the effects of the pandemic. In order to remain profitable, they had to adapt to the changes in consumer behavior, which saw an accelerated shift to online purchases amid the community quarantines.
For one, this conglomerate is known for having it all for its customers. However, what would be the use of having everything when customers suddenly don’t have a convenient way to purchase their products? To address this issue, this company decided to strengthen its online presence while still improving its physical operations.
However, as-reported metrics show that the company isn’t benefiting from this development at all. Uniform return on assets (ROA), on the other hand, reveals the company has actually achieved above cost-of-capital returns even in a bad year.
Also below, Uniform Accounting Embedded Expectations Analysis and the Uniform Accounting Performance and Valuation Tearsheet for the company.
Philippine Markets Newsletter:
Wednesday Uniform Earnings Tearsheets – Philippine-listed Focus
Powered by Valens Research
It’s been more than a year since the pandemic ravaged the globe, resulting in many businesses temporarily or permanently closing.
In the Philippines, even the biggest conglomerates were not immune to the impacts of the pandemic. We’ve previously discussed two—JG Summit Holdings (JGS:PHL) and Aboitiz Equity Ventures (AEV:PHL).
Today, we’ll talk about the country’s largest company in terms of market capitalization, SM Investments Corporation (SM:PHL), or the SM Group.
The SM Group engages in shopping mall development and management, real estate development, financial services, and tourism, among others.
Despite its diverse portfolio, the SM Group reported a significant drop of 48% on its net income in 2020 at PHP 23.4 billion versus PHP 44.6 billion in 2019.
Specifically, two of the SM Group’s most affected businesses are SM Retail and property developer SM Prime Holdings, Inc. (SMPH:PHL) as shopping malls were forced to close in 2020, resulting in 67% and 53% drop in net income, respectively.
In order to offset those losses, the company had to come up with new ways to battle the pandemic’s impact. For one, the SM Group began to conduct a hybrid approach by capitalizing on its online assets while still strengthening its physical operations.
As the company’s tagline goes, “we’ve got it all for you,” customers who are not able to leave their houses will still have the opportunity to buy from a wide range of essential and nonessential products through the SM Group’s online shopping channels, ShopSM, and THE SM STORE.
The company also took advantage of digital messaging by providing content and shopping options for its retail products and services to Viber communities.
Furthermore, the SM Group innovated different mall-fulfillment services aside from the usual take-out and delivery options for establishments such as click-and-collect, curbside pickup, smartphone messaging, ‘personal shopper’, and ‘call to deliver’ options.
Besides focusing on retail and mall improvements, the SM Group’s SM Development Corporation (SMDC) partnered with online real estate company Lamudi, enabling the company to list its projects on the latter’s platform.
Overall, the company’s ability to shift most of its business online helped the SM Group withstand the negative impact of the pandemic. However, as-reported data seems to show that this isn’t so, with ROAs only reaching 3% in 2020.

In reality, the company’s digital initiatives actually proved that the company actually did much better than expected, with Uniform ROAs achieving above cost-of-capital levels.

One of the reasons for the discrepancy is the treatment of non-operating long-term investments according to the Philippine Financial Reporting Standards (PFRS).
Based on PFRS, non-operating long-term investments are part of the company’s balance sheet, but in reality, non-operating long-term investments are not essential to the firm’s assets and should be removed from the total assets.
For example, in 2020, the SM Group recognized a non-operating long-term investment of PHP 385.8 billion, accounting for 32% of its as-reported total assets of PHP 1.2 trillion.
After removing the PHP 385.8 billion from the asset base and with the many other adjustments Valens makes, we arrive at a TRUE earning power of 6%.
The SM Group’s earning power is stronger than you think

As-reported metrics distort the market’s perception of the firm’s historical profitability. If you were to just look at as-reported ROA, you would think that SM Investments’ profitability is lower than what real economic metrics highlight in all years.
In reality, the SM Group’s true profitability has consistently been higher than its as-reported ROA since 2005. For example, as-reported ROA was 5% in 2018, but Uniform ROA is displaying much stronger profitability at 15%.
Historically, as-reported ROA has remained at 5%-6% levels through 2019, before compressing to a low of 3% in 2020.
Meanwhile, Uniform ROA declined from 14% in 2005 to 9% in 2008, before improving to and maintaining 11%-12% levels through 2017. Since then, Uniform ROA has jumped to a peak of 15% in 2018, before contracting to a low of 6% in 2020.
The SM Group’s earnings margin is much weaker than you think, but its Uniform asset turns make up for it
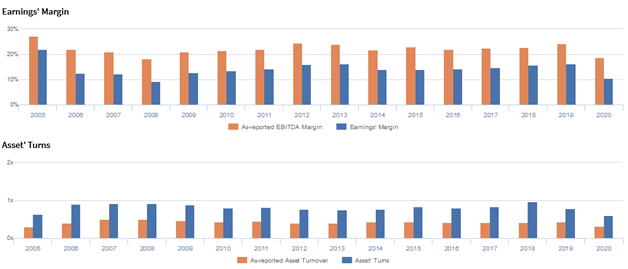
Trends in Uniform ROA have been driven by trends in Uniform earnings margin, and most recently, trends in Uniform asset turns.
Uniform margins declined from a peak of 22% in 2005 to 9% in 2008, before expanding to 16% levels in 2012-2013 and compressing to 14%-15% levels in 2014-2017. Since then, Uniform margins recovered back to 16% in 2018-2019, before dropping to 10% in 2020.
Meanwhile, after improving from 0.6x in 2005 to 0.8x-0.9x levels through 2017, Uniform turns further jumped to 1.0x in 2018, before declining to 0.6x in 2020.
At current valuations, the market is pricing in expectations for a reversal of recent declines in both Uniform margins and Uniform turns.
SUMMARY and SM Investments Corporation Tearsheet
As our Uniform Accounting tearsheet for SM Investments Corporation (SM:PHL) highlights, the company trades at a Uniform P/E of 41.7x, above the global corporate average of 24.3x and its historical P/E of 30.8x.
High P/Es require high EPS growth to sustain them. In the case of the SM Group, the company has recently shown a 67% Uniform EPS shrinkage.
Sell-side analysts provide stock and valuation recommendations that in general provide very poor guidance or insight. However, sell-side analysts’ near-term earnings forecasts tend to have relevant information.
We take sell-side forecasts for Philippine Financial Reporting Standards (PFRS) earnings and convert them to Uniform earnings forecasts. When we do this, the SM Group’s sell-side analyst-driven forecast is to see a Uniform earnings growth of 94% and 44% in 2021 and 2022, respectively.
Based on current stock market valuations, we can use earnings growth valuation metrics to back into the required growth rate to justify the SM Group’s PHP 965.00 stock price. These are often referred to as market-embedded expectations.
The company is currently being valued as if Uniform earnings were to grow 9% annually over the next three years. What sell-side analysts expect for the SM Group’s earnings growth is well above what the current stock market valuation requires in 2021 and 2022.
Furthermore, the company’s earning power is slightly above the long-run corporate average. However, cash flows and cash on hand are below their total obligations—including debt maturities, capex maintenance, and dividends. Together, this signals a high credit and dividend risk.
To conclude, the SM Group’s Uniform earnings growth is above its peer averages, but currently trades below its average peer valuations.
About the Philippine Market Newsletter
“Wednesday Uniform Earnings Tearsheets – Philippine-listed Focus”
Some of the world’s greatest investors learned from the Father of Value Investing or have learned to follow his investment philosophy very closely. That pioneer of value investing is Professor Benjamin Graham. His followers:
Warren Buffett and Charles Munger of Berkshire Hathaway; Shelby C. Davis of Davis Funds; Marty Whitman of Third Avenue Value Fund; Jean-Marie Eveillard of First Eagle; Mitch Julis of Canyon Capital; just to name a few.
Each of these great investors studied security analysis and valuation, applying this methodology to manage their multi-billion dollar portfolios. They did this without relying on as-reported numbers.
Uniform Adjusted Financial Reporting Standards (UAFRS or Uniform Accounting) is an answer to the many inconsistencies present in GAAP and IFRS, as well as in PFRS.
Under IFRS, each company’s financial statements are rebuilt under a consistent set of rules, resulting in an apples-to-apples comparison. Resulting UAFRS-based earnings, assets, debts, cash flows from operations, investing, and financing, and other key elements become the basis for more reliable financial statement analysis.
Every Wednesday, we focus on one Philippine-listed company that’s particularly interesting from a UAFRS vs as-reported standpoint. We highlight one adjustment that illustrates why the as-reported numbers are unreliable.
This way, we gain a better understanding of the factors driving a particular stock’s returns, and whether or not the firm’s true profitability is reflected in its current valuations.
Hope you’ve found this week’s Uniform Earnings Tearsheet on a Philippine company interesting and insightful.
Stay tuned for next week’s Philippine company highlight!
Regards,
Angelica Lim
Research Director
Philippine Markets Newsletter
Powered by Valens Research
www.valens-research.com